Software Metrics
Capers Jones wrote the great book Applied Software Measurement. This comprehensive book contains a wealth of information for the importance and use of metrics for estimation, project management, implementation, quality and customer satisfaction. In this post I summarise a small number of important points he makes in chapter one (Introduction). Full details can be found in the book with detailed exploration of the issues in later chapters.
Data Types
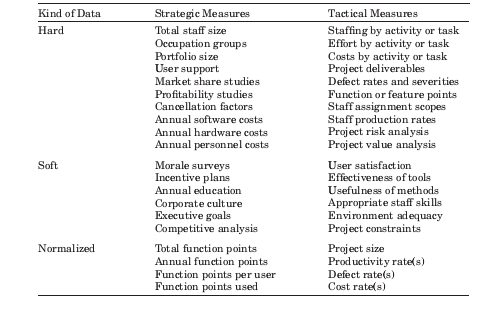
Software measurement deals with three kinds of essential information:
-
Hard data
-
Soft data
-
Normalised data
Hard data
Hard data can be quantified almost completely objectively. High accuracy is possible and desirable. Key metrics include:
-
Project personnel
-
Effort on project tasks
-
Schedule elapsed time of tasks
-
Project documentation, code and test cases volume
-
Defects found
-
Cost expended for each activity
Note that due to unpaid overtime, costs incurred and hours of effort expended do not directly map.
Granularity must be fine enough to measure the effort for specific activities. It is common to use the basic activities of requirements, design, code, test and installation. However, this does not allow cost and benefit analysis of the various other activites and does not handle activities such as document that cross these boundaries. See my post on Development Activities for the various activities and typical effort percentages expended.
Soft Data
This category includes data where judgement is required, therefore perfect accuracy is not necessary. This includes:
-
Skill and experience of team
-
Schedule pressures
-
Requirements stability over time
-
User satisfaction
-
Expertise and co-operation of users
-
Adequacy of project tools and methods
-
Office space of team
-
Business value to the organisation
Soft data can be extremely useful to explain the differences in productivity and quality, leading to insights and possible improvements. Care must be given to choosing the right factors and data collection mechanism. This is the most technically difficult task of metrics.
Normalised Data
Standardised metrics used to compare projects' productivity and quality. This was formerly a longtime industry problem. Lines of code (LOC) measurements typically ignored the different abstraction mechanisms available in programming languages and were therefore unsuitable for productivity measurements defined by the good or service produced per unit of expense. Albrecht first produced function points at IBM and have largely replaced LOC as the preferred unit of measurement. Function points are constant regardless of language used.
The major factors that contribute to software productivity are:
-
Size of applications
-
Activities performed
-
Variations in the soft factors
-
The type of software developed
To compare how the application type affects productivity consider the following data on the US productivity per application type in function points per staff month.
Application Type |
1990 |
1995 |
2005 |
End-user |
47.00 |
52.00 |
52.00 |
Web |
NA |
12.00 |
23.00 |
MIS |
7.20 |
7.80 |
9.40 |
Outsourced |
8.00 |
8.40 |
9.70 |
Systems |
4.00 |
4.20 |
6.80 |
Commercial |
5.10 |
5.30 |
7.20 |
Military |
2.00 |
1.80 |
3.75 |
Average |
10.47 |
13.07 |
15.98 |
Average without end-user software |
4.38 |
6.58 |
9.98 |
Strategic and Tactical Software Measurement
Corporate strategy concerns the overall business plan whilst tactics concerns the steps to achieve to strategy. For measurement, strategic factors affect the entire organisation whilst tactical measurements concern projects.
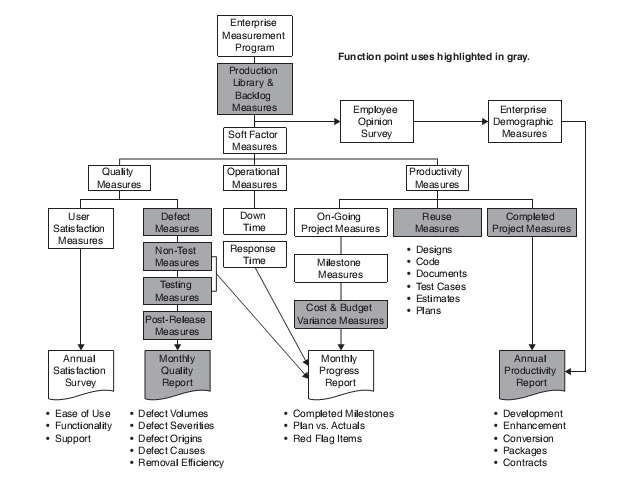
Structure of Full Software Measurement System
A full measurement system will include productivity and quality measurements with monthly and annual reports.
Justification
For most companies that are not leading edge (e.g. Micrsoft, Google, IBM, etc.) measurements programs are exotic concepts.
Value
Many project managers in organisations that do not measure productivity have a vested interest in not performing measurements. They may suspect they performance will not be shown favourably and can obstruct progress. Software measurement is a powerful defect prevention and removal activity. Given quality is a significant factor is productivity it is perhaps not suprising that typical ROI is 17:1.
Costs
Annual costs for a large programme can be 4-6% of the software budget (2% for productivity, 2-3% for quality), certainly a significant budget expense. However, the large sophisticated companies have the best record for project completion, user satisfaction, employee morale and employee satisfaction.
Typical Programme Sequence
-
Operational measures - record key computer utilisation, downtime and response time.
-
Ongoing project measures - Monthly status reports on milestones and planned vs actual expenditure.
-
Production library and backlog measures - The organisation’s software investment.
-
User satisfaction measures - Interviews with users. Forms and questionairres are also used, but less useful.
-
Completed project measures - Function points of completed projects.
-
Soft factors - The right and wrong way a company does business. Survey the methods, tools, skill, etc. on a project basis.
-
Defect measures - Defect rates. Rate of finding and fixing defects.
-
Demographic measures - Annual demographic surveys of skills in the company relevant to company goals.
-
Opinion survey - Staff opinion surveys, the greatest change to corporate culture.
Conclusion
The scientific method is the best method we know of to progress scientific and engineering work. This requires measurement of current performance, performing a change and measuring the new, hopefully improved, performance. Companies trying to improve without measurement fall prey to the typical fads and fortune of the software industry. To progress software engineering as a true engineering discipline the software industry must learn to make and utilise measurements.
Bibliography
-
Jones, Applied Software Measurement: Global Analysis of Productivity and Quality, Third Edition, 2008.


